Nomogram
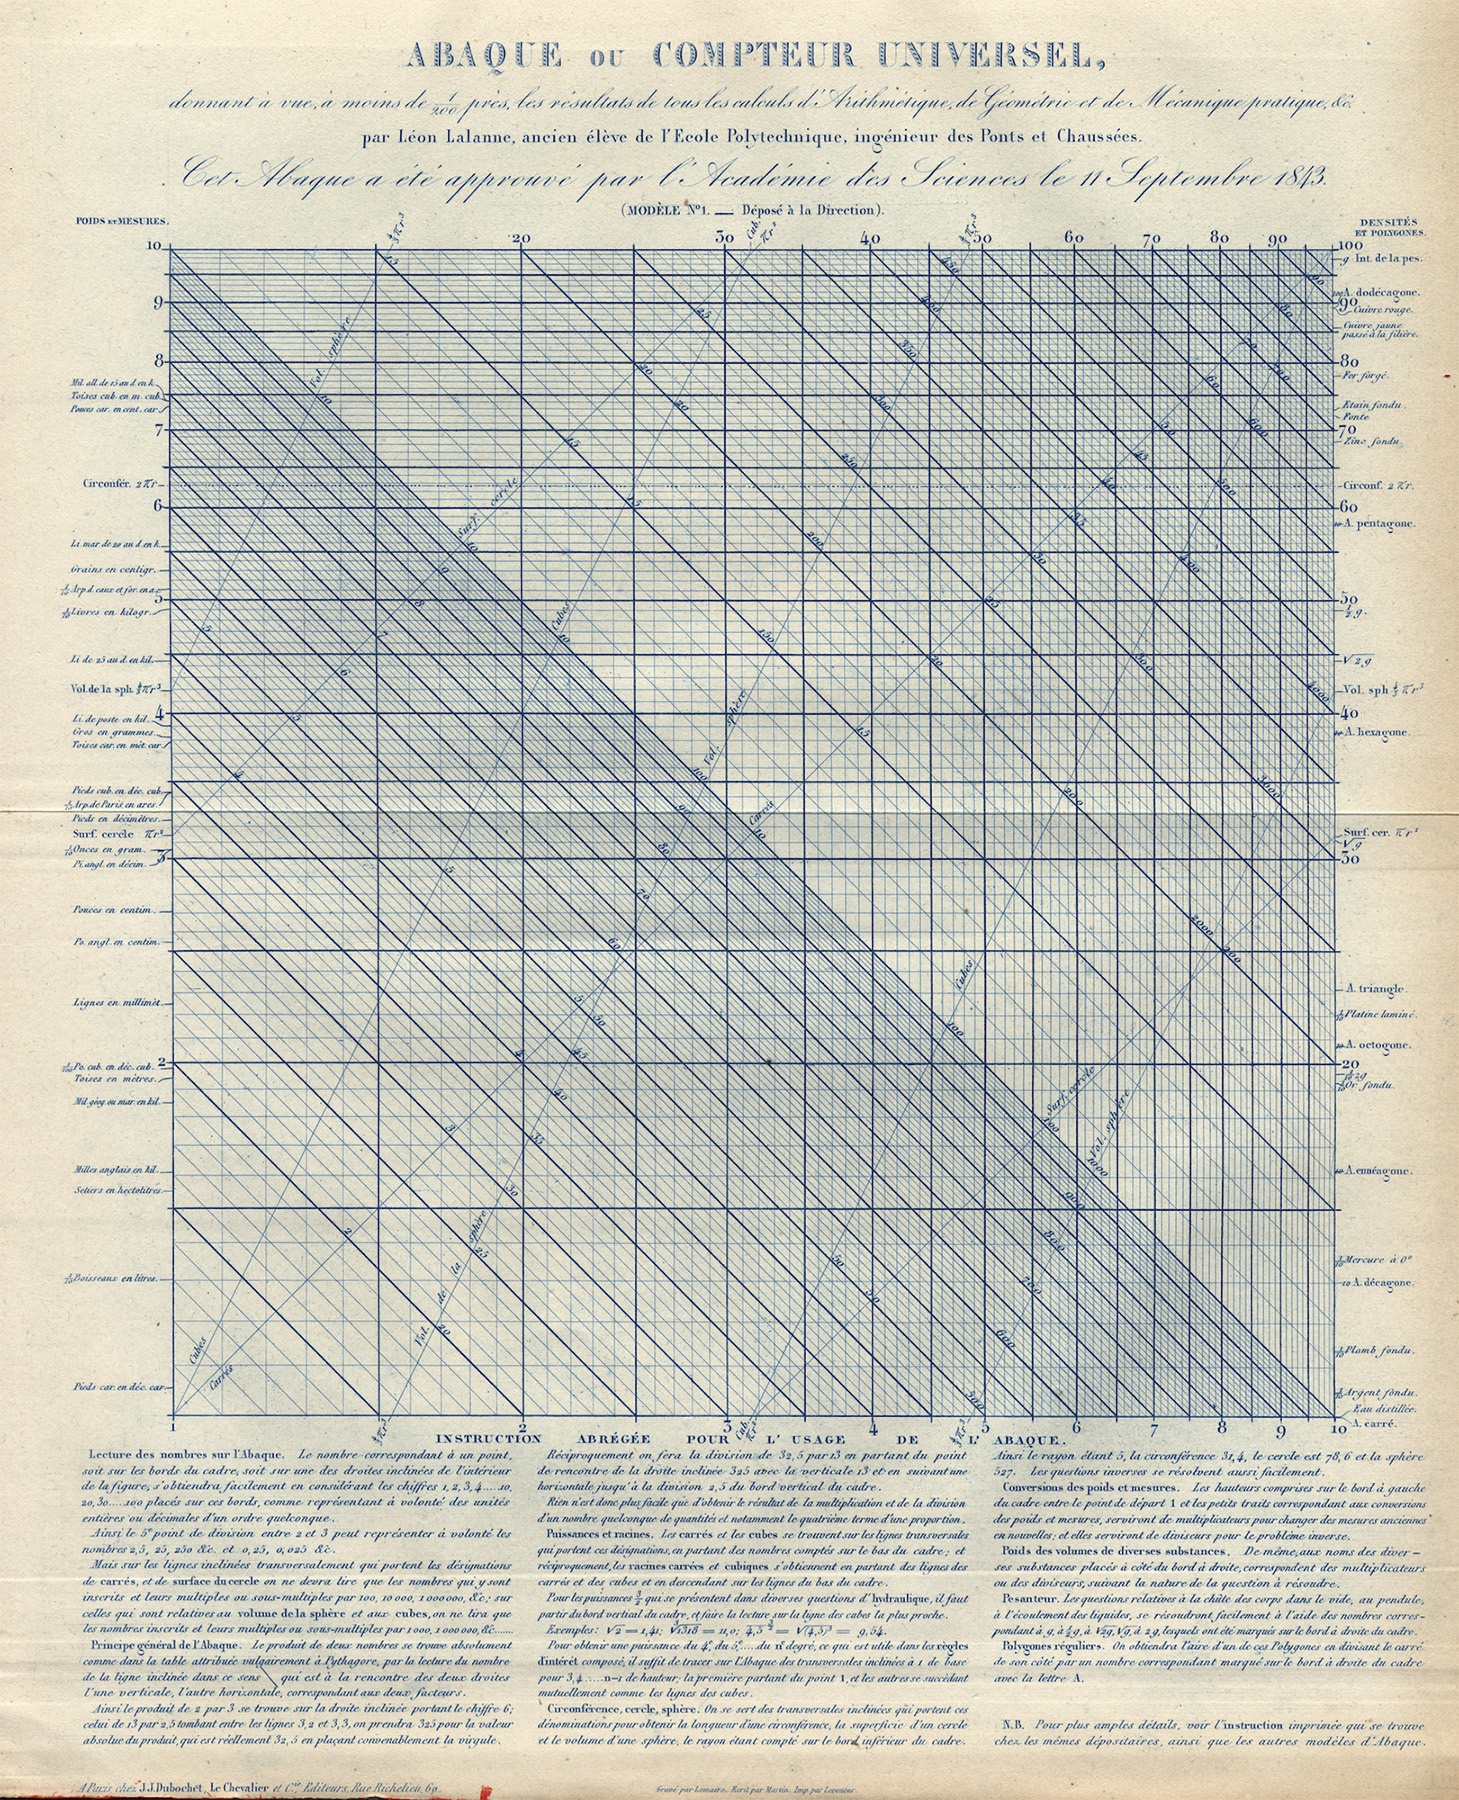
Also called: Nomograph, Alignment Chart or Abaque
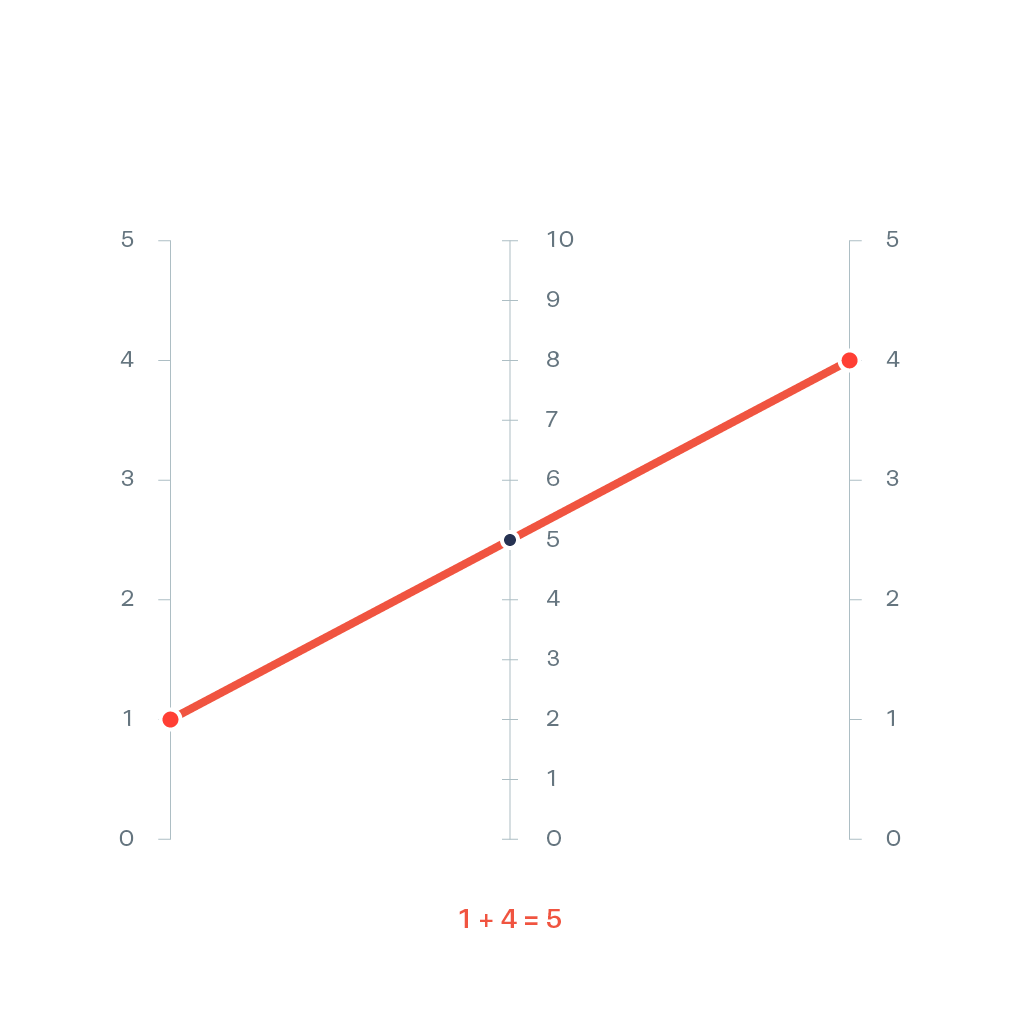
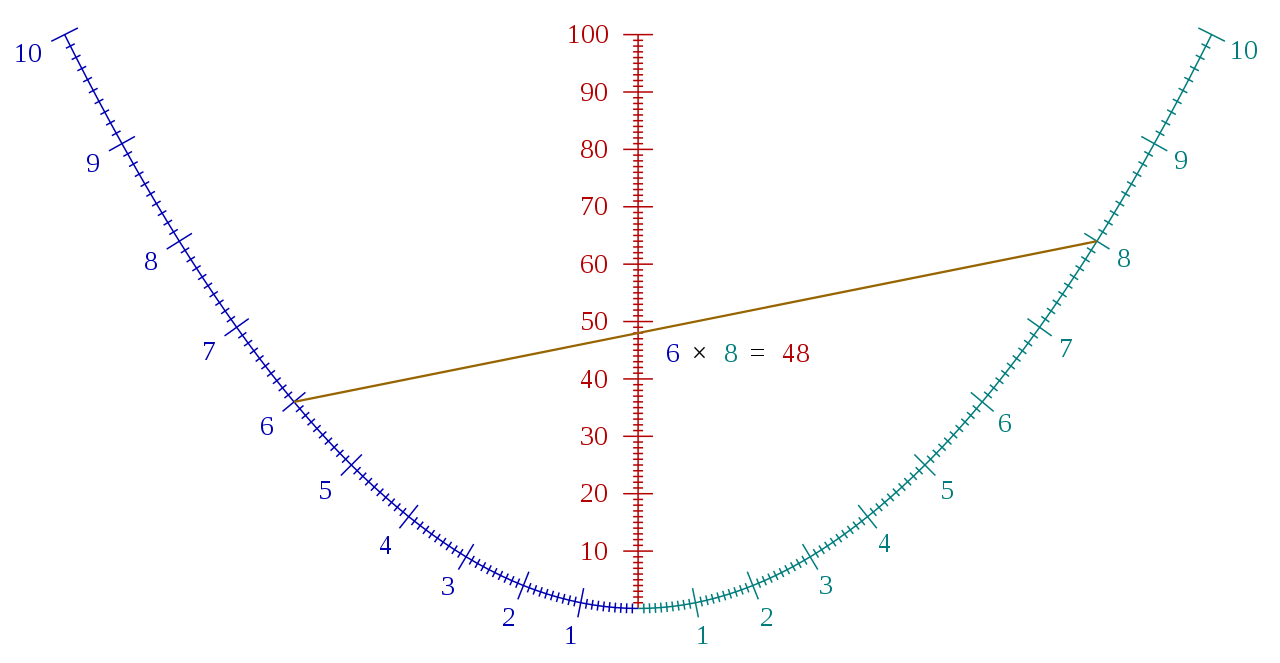
A nomogram is a chart that is used as a tool for visual calculation. It consists of several graduated scales, precisely placed and sized in the chart. Each scale represents a variable in the equation to solve. Knowing all but one variable, the user of the nomogram connects the known values across their scales, typically with a straight line. The value of the unknown variable is discovered by reading on its corresponding scale the point where the plotted line is crossing.