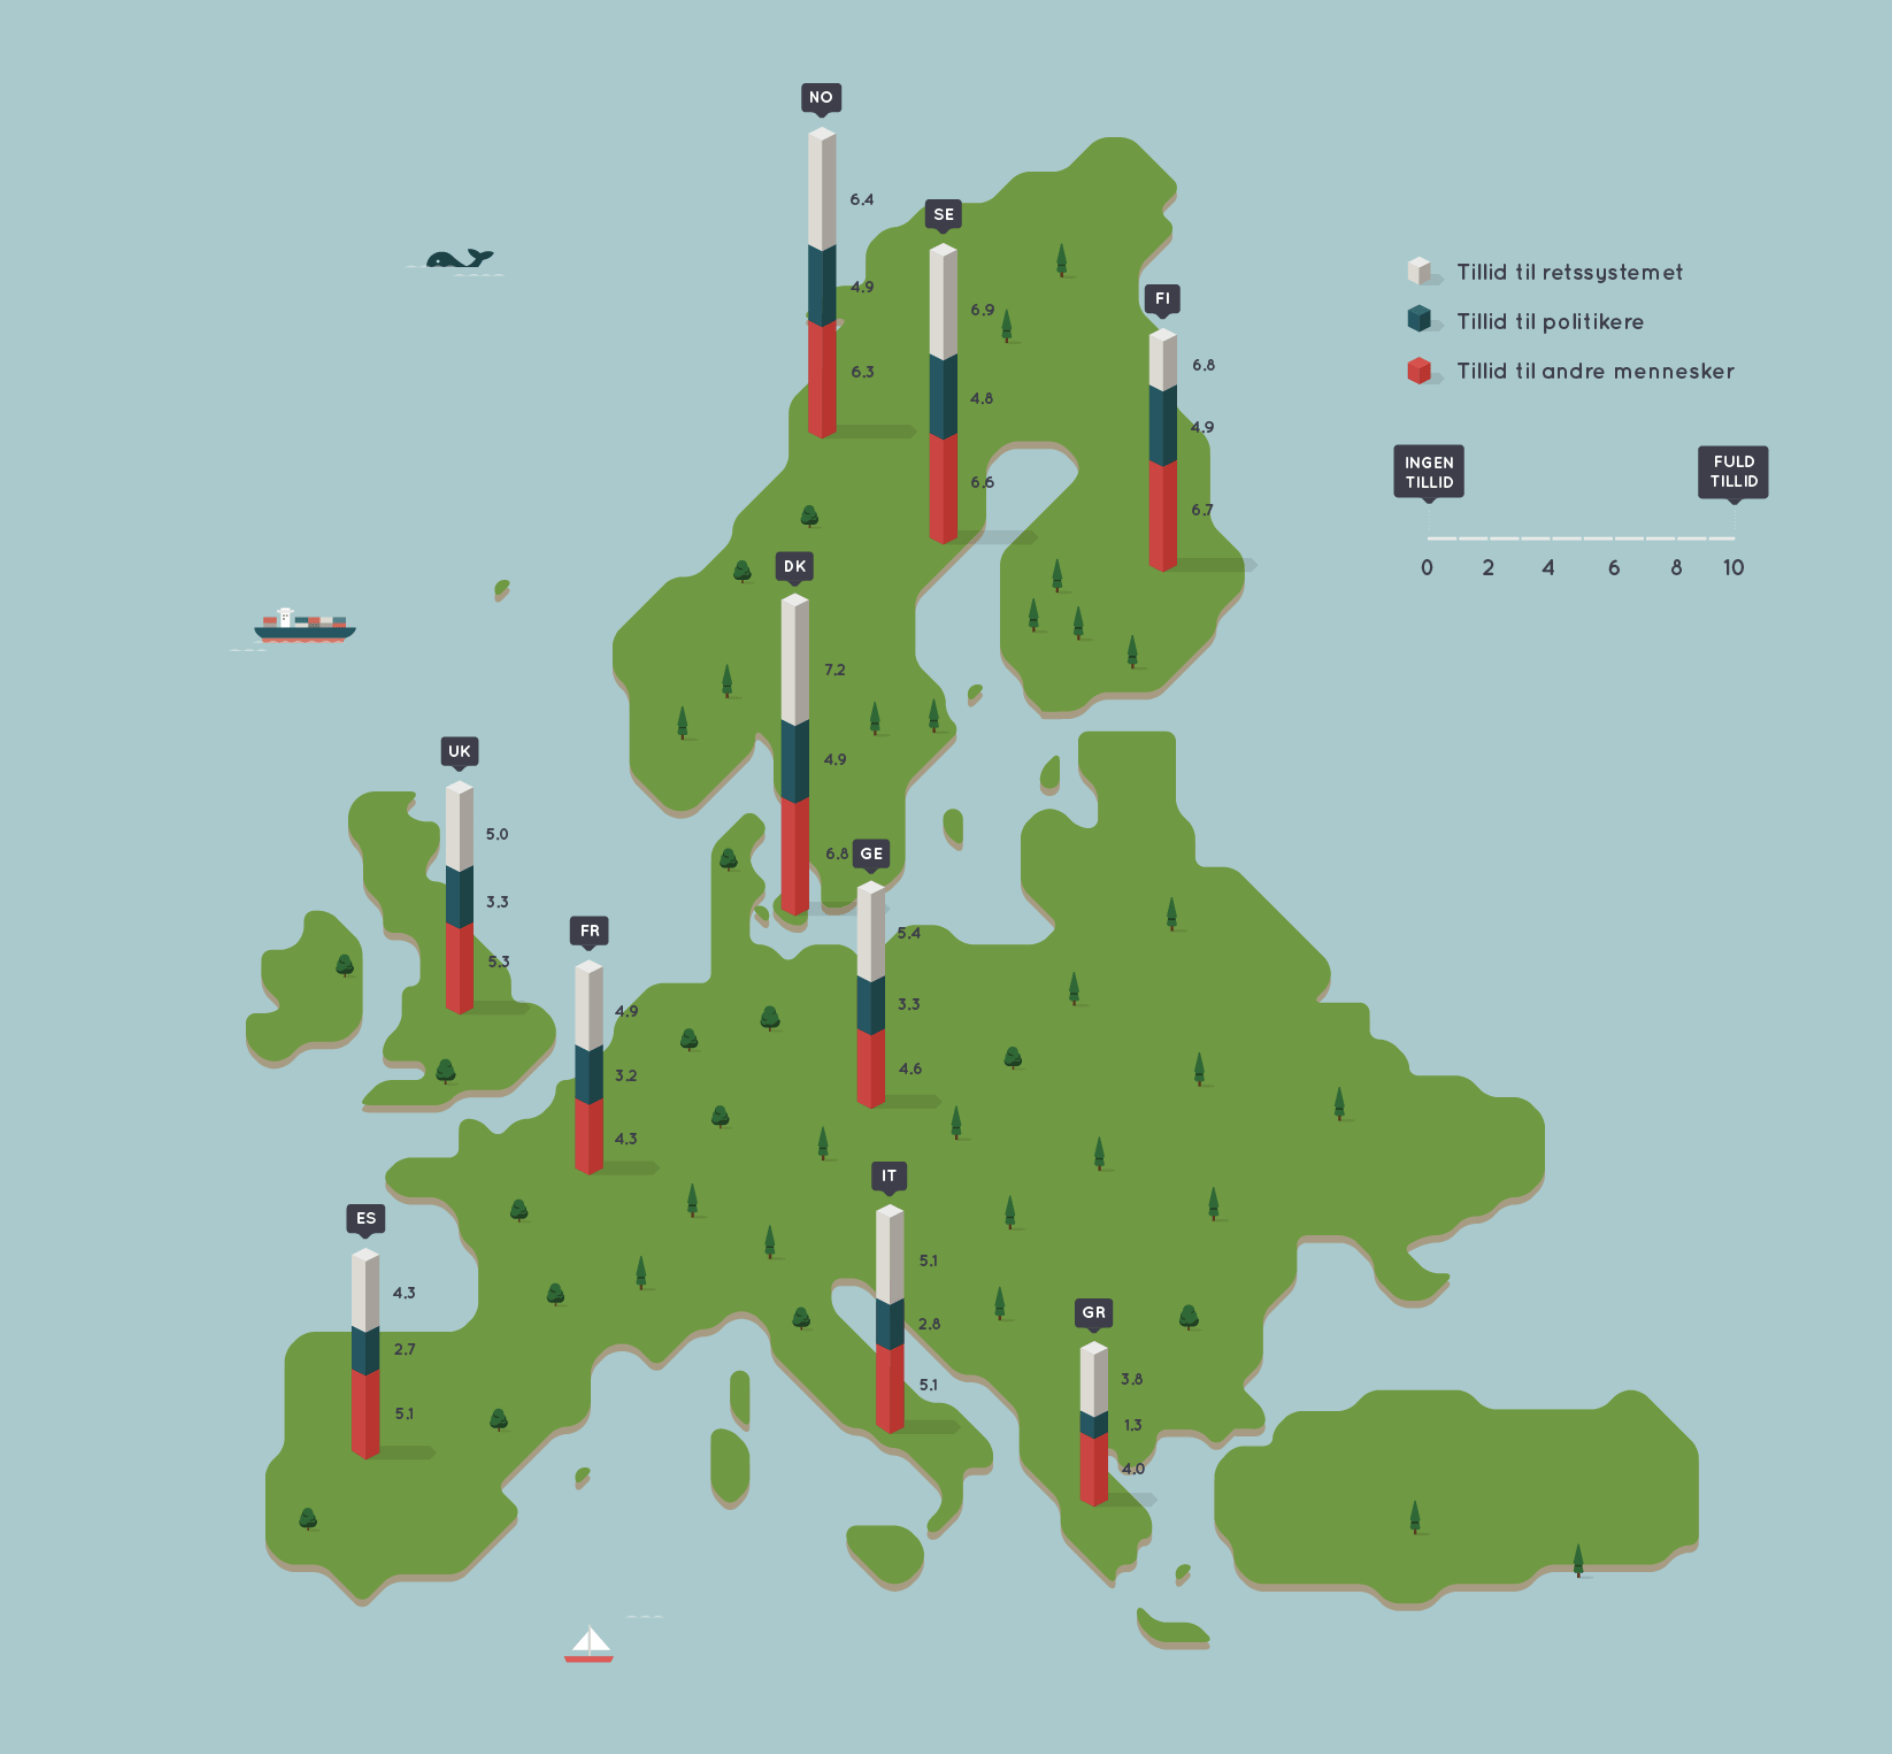
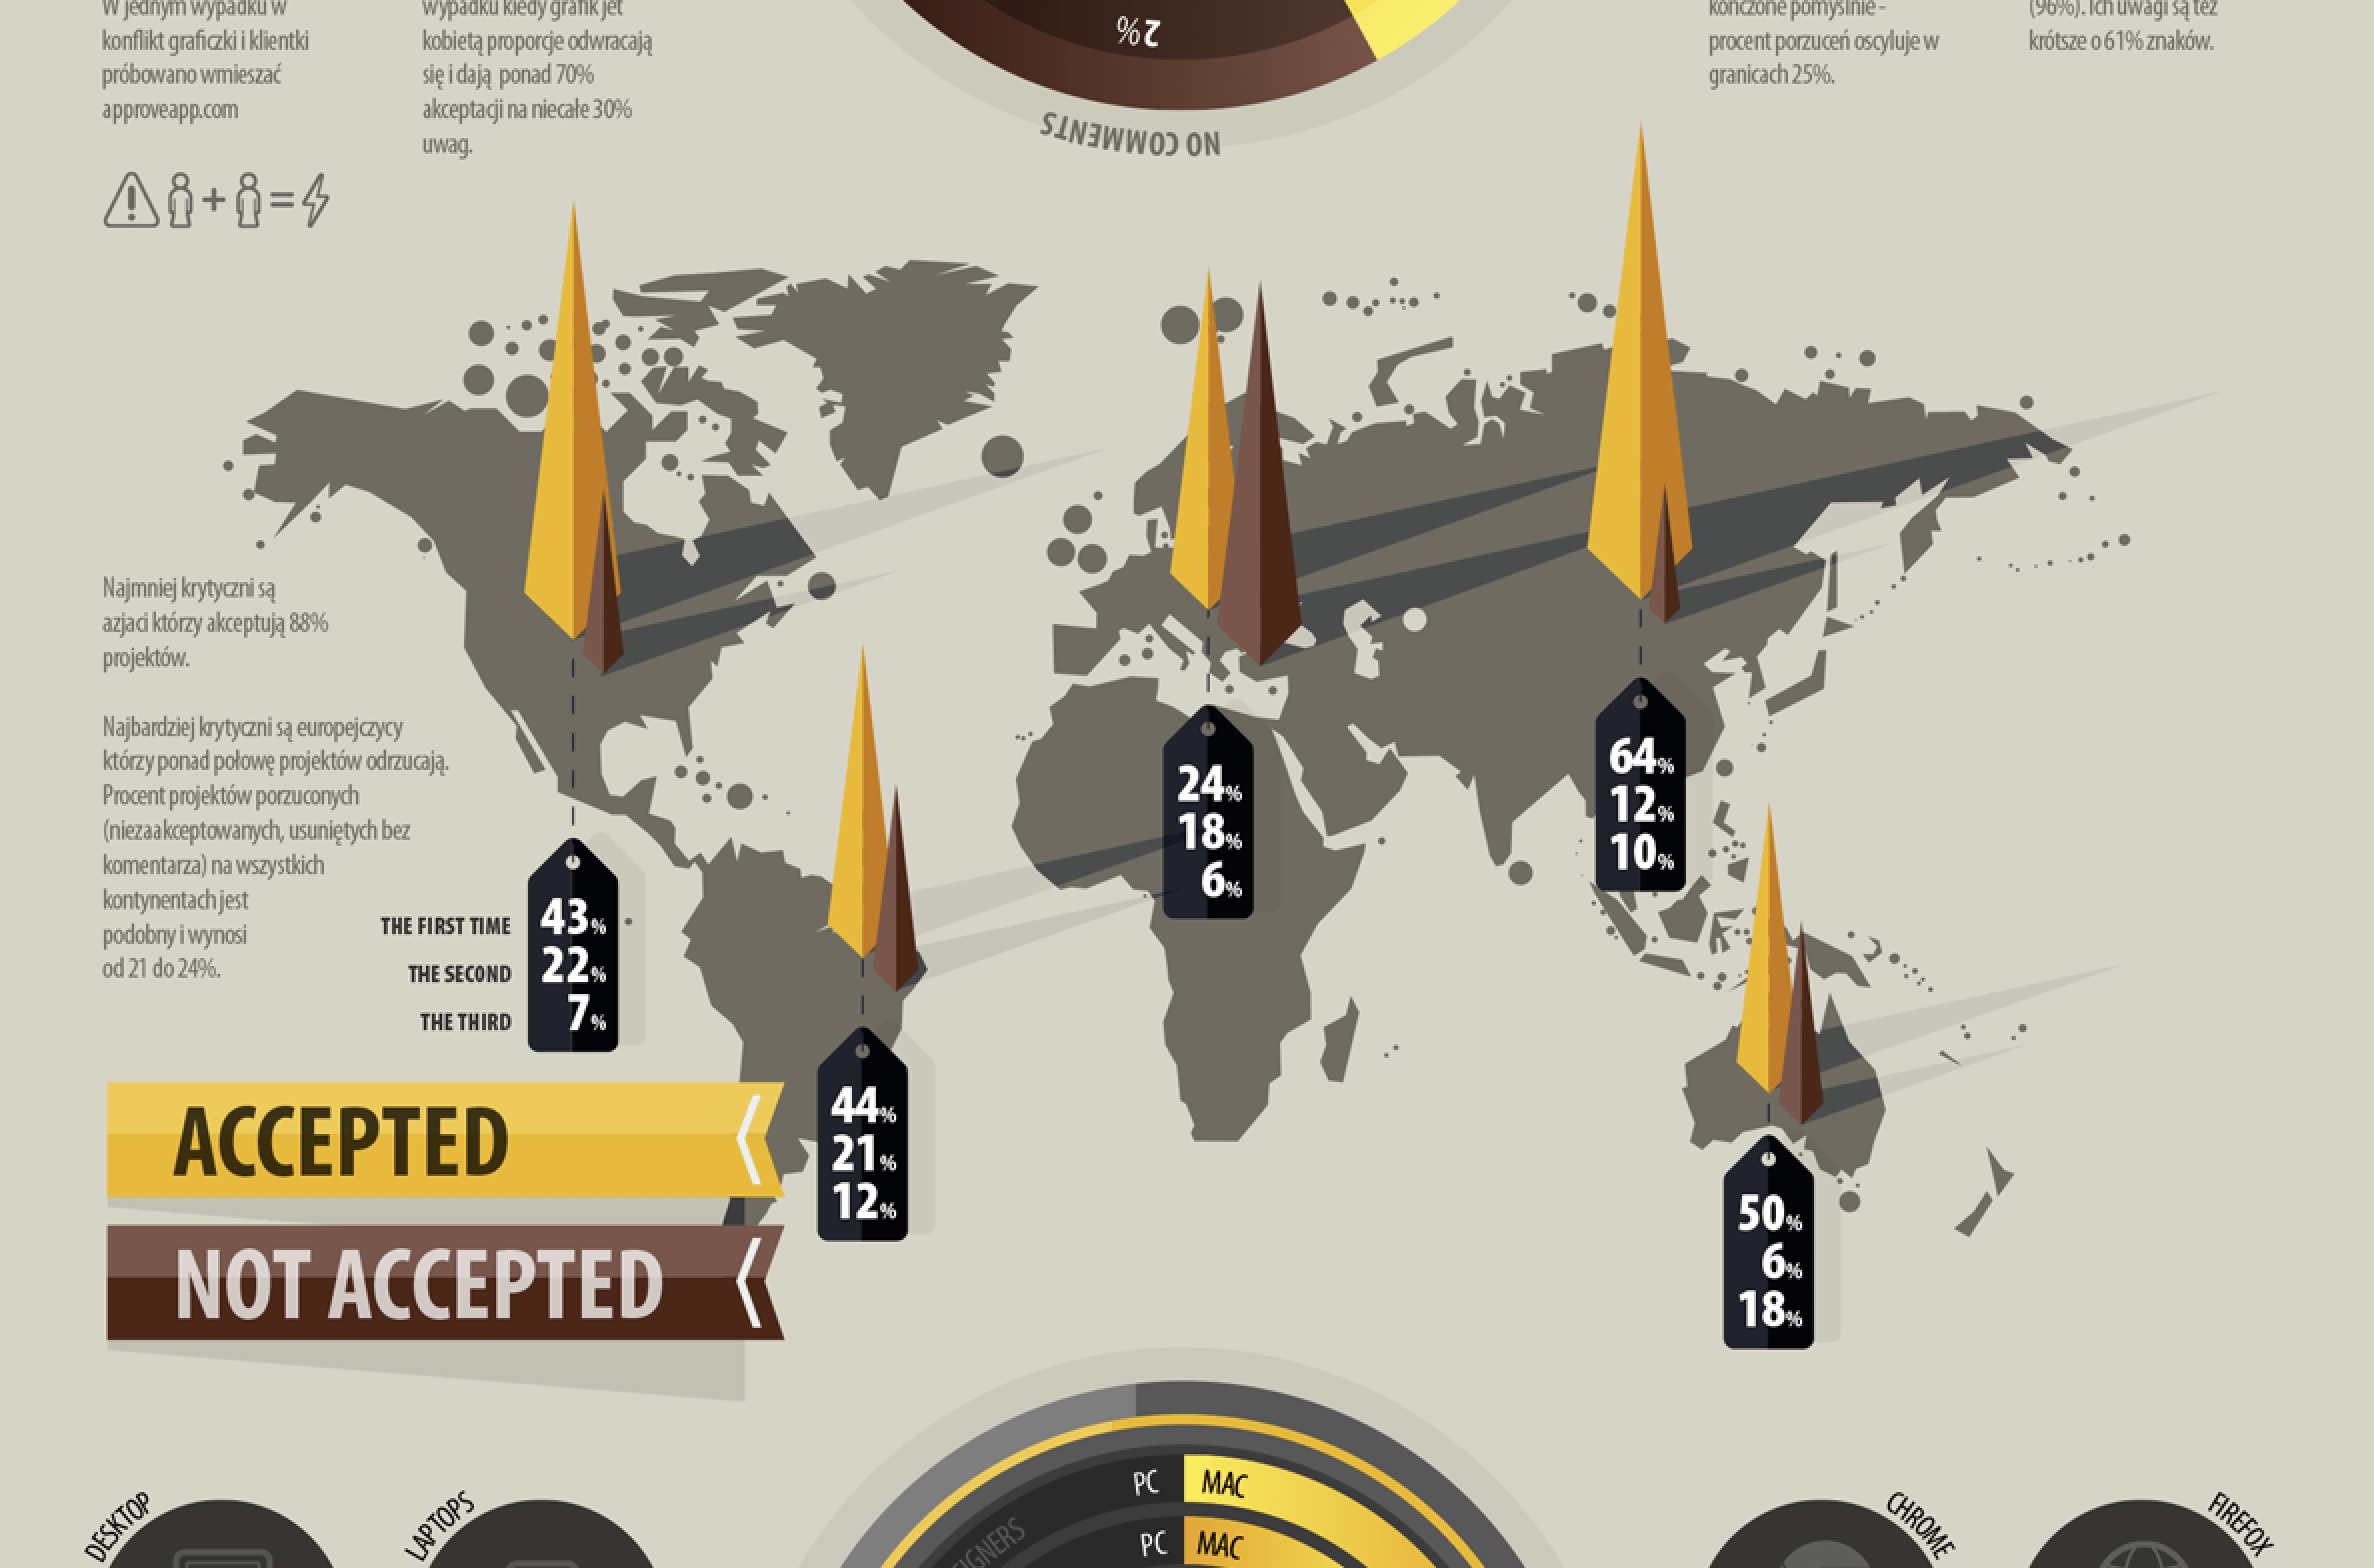
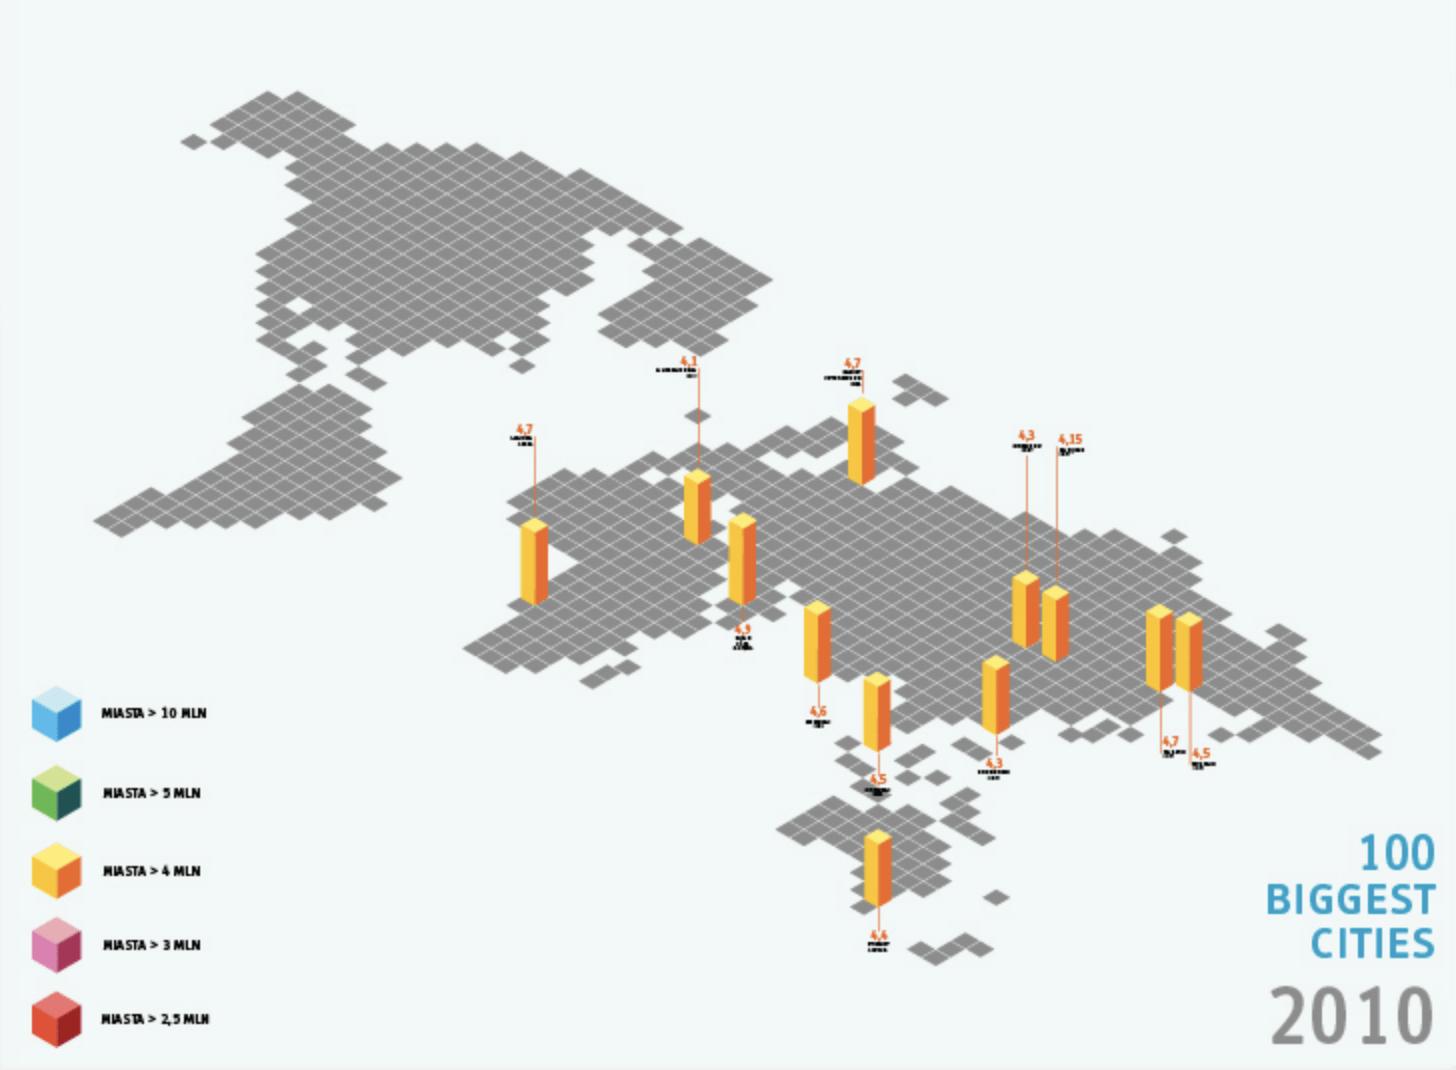
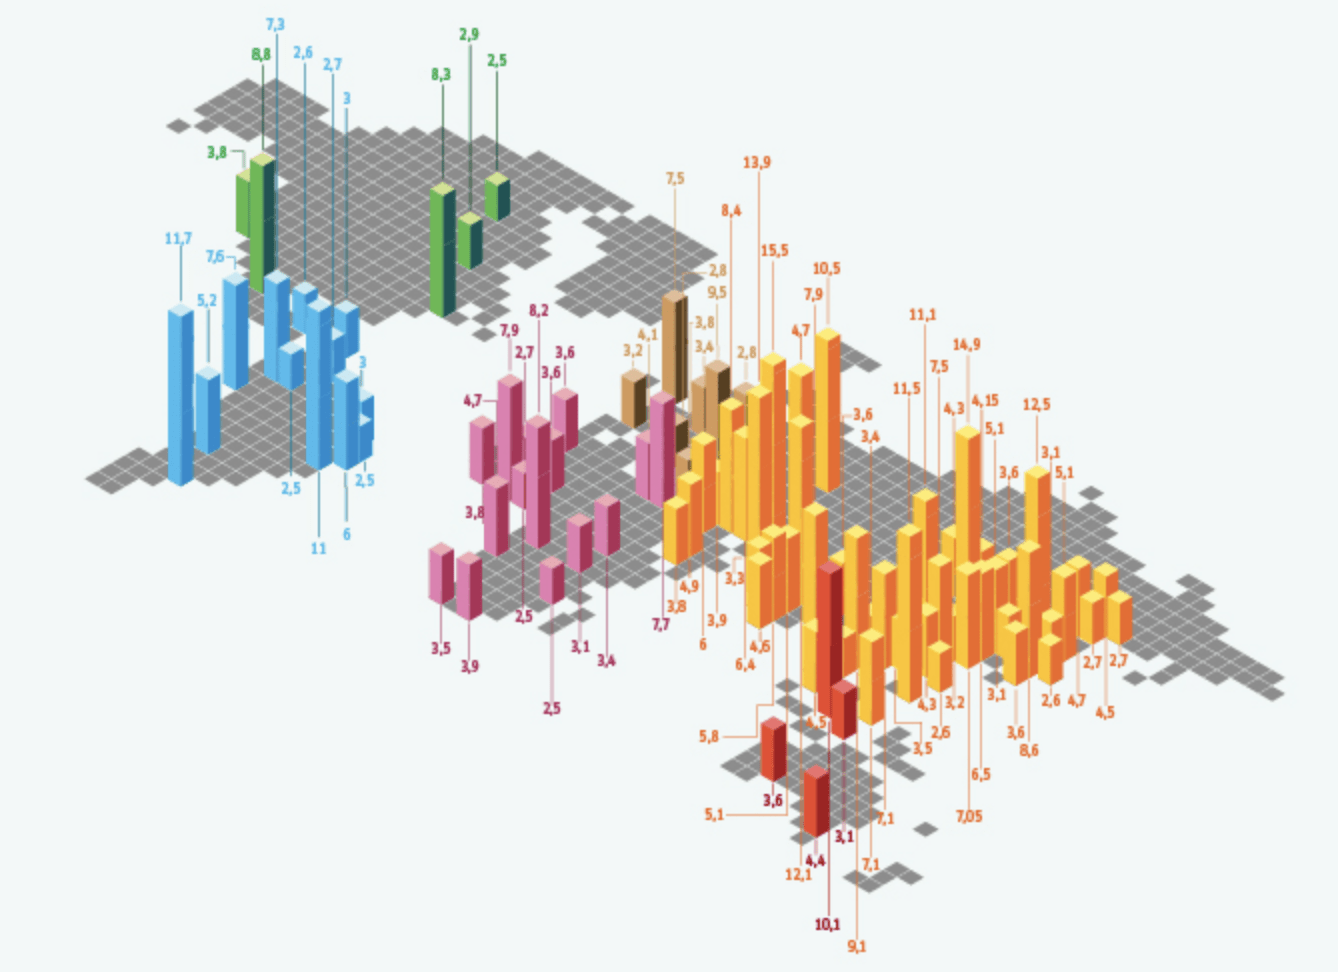
Bar Chart on a Map

Bar chart on a map is a combination of a map with locations and a bar chart. It is useful when presenting geospatial data along values. The location could represent a city, a country or any other kind of location. Like a bar chart, the height or volume of each bar is proportional to the values it represents.