Kagi Chart

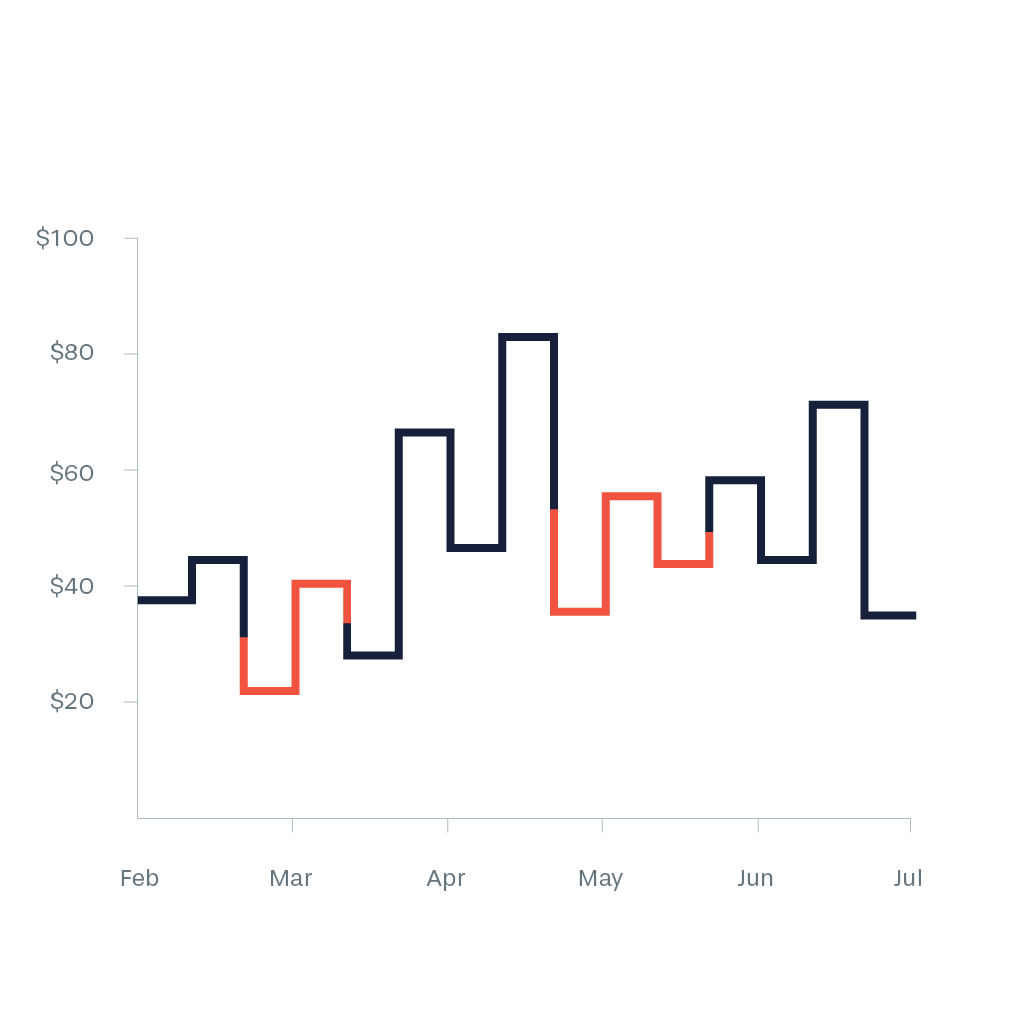
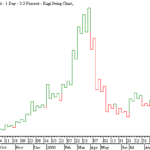
Kagi charts look similar to swing charts and do not have a time axis. A Kagi chart is created with a series of vertical lines connected by short horizontal lines. The Kagi chart is a chart used for tracking price movements and to make decisions on purchasing stock. It differs from traditional stock charts, such as the Candlestick chart by being mostly independent of time. This feature aids in producing a chart that reduces random noise.


