Hive Plot

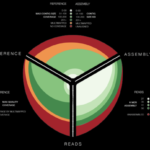
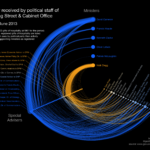
The hive plot is a rational visualization method for drawing networks. Nodes are mapped to and positioned on radially distributed linear axes — this mapping is based on network structural properties. Edges are drawn as curved links. Simple and interpretable.
The purpose of the hive plot is to establish a new baseline for visualization of large networks — a method that is both general and tunable and useful as a starting point in visually exploring network structure.

