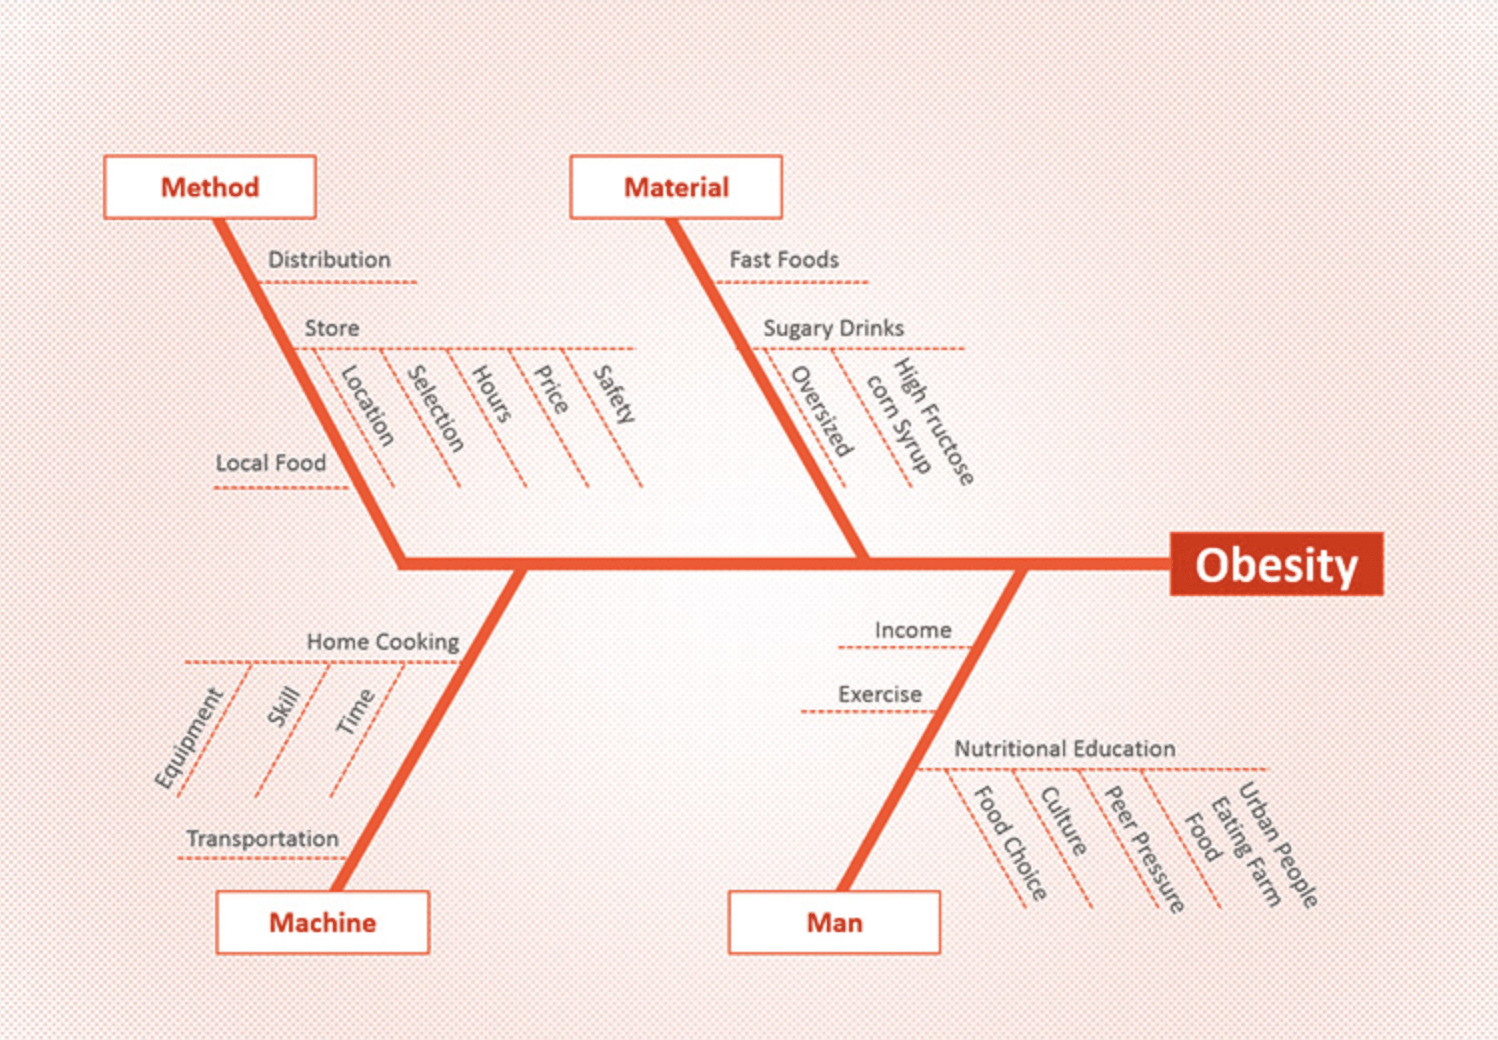
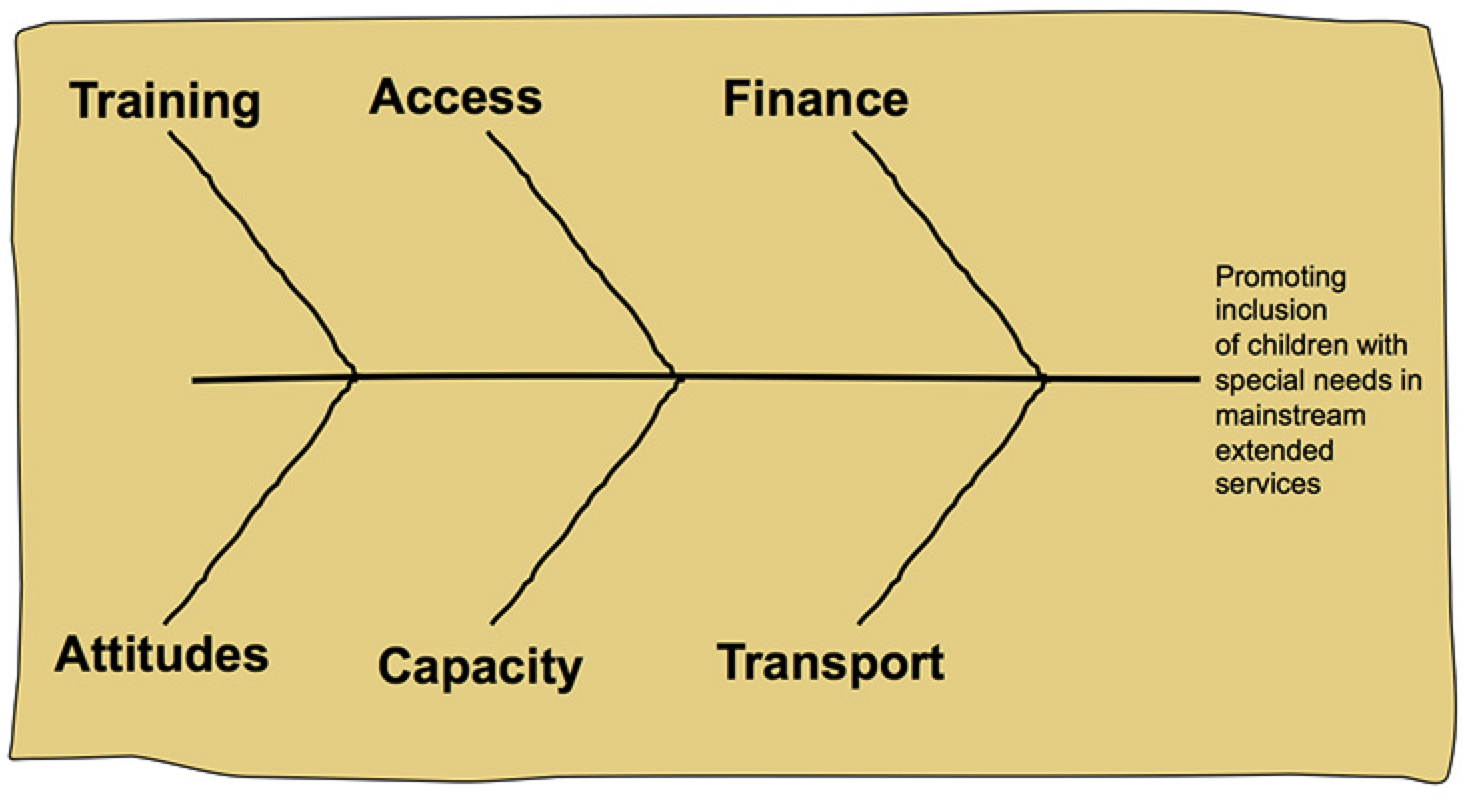
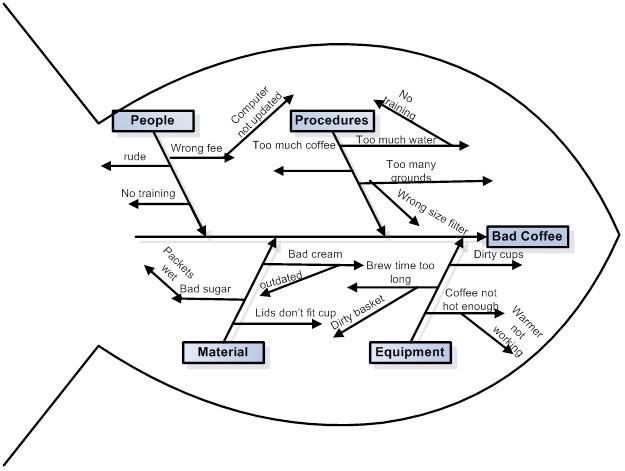
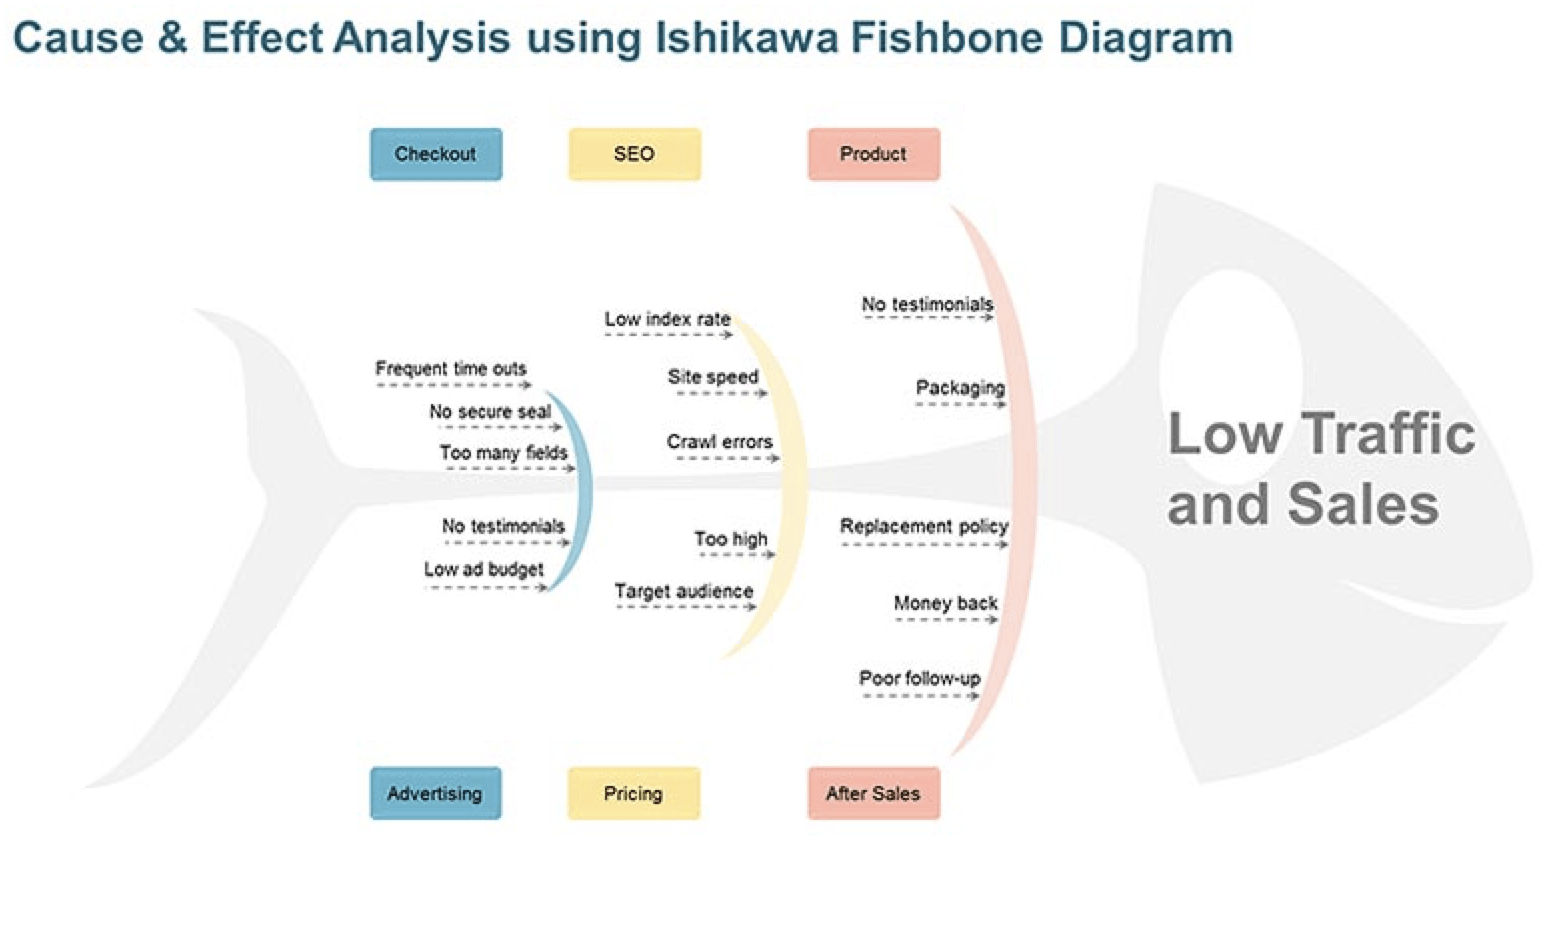
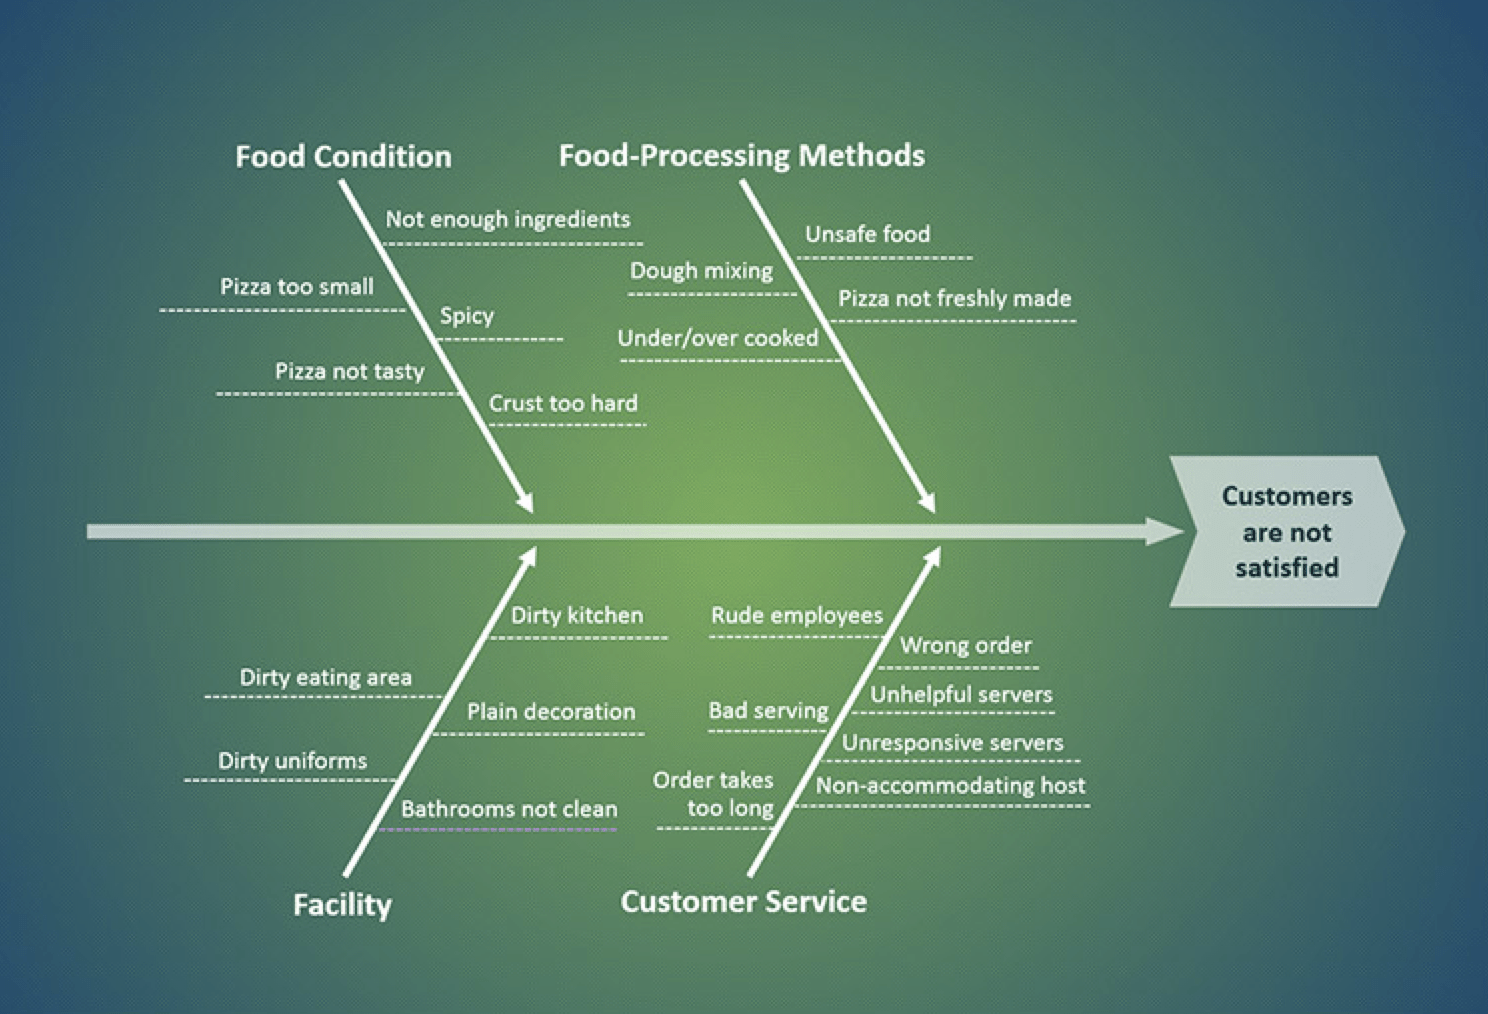
Fishbone Diagram
Also called: Ishikawa diagram, Cause-and-effect Diagram, Fishikawa, Herringbone Diagram
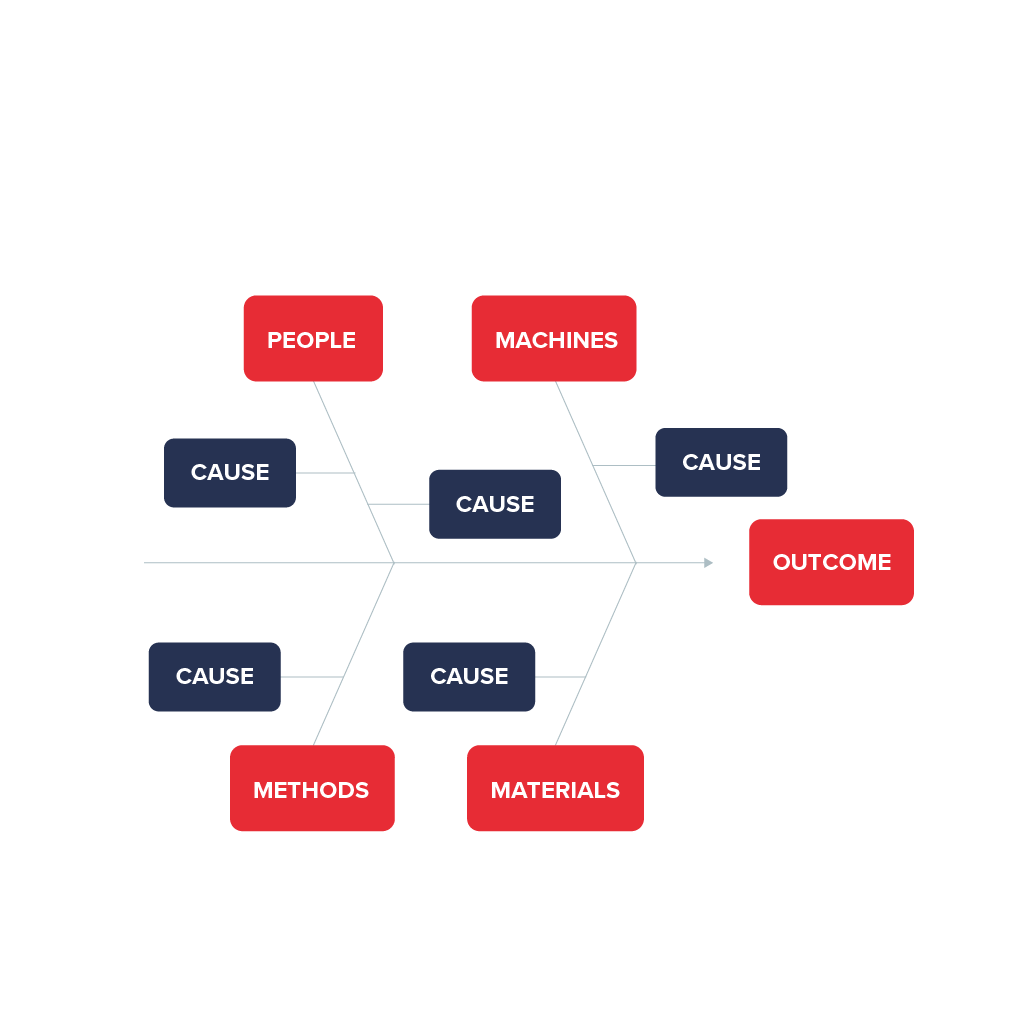
Fishbone Diagrams are causal diagrams that show the causes of a specific event. Common uses of the Fishbone Diagram are product design and quality defect prevention, to identify potential factors causing an overall effect. Each cause or reason for imperfection is a source of variation. Causes are usually grouped into major categories to identify these sources of variation.