Compound Bubble and Pie Chart
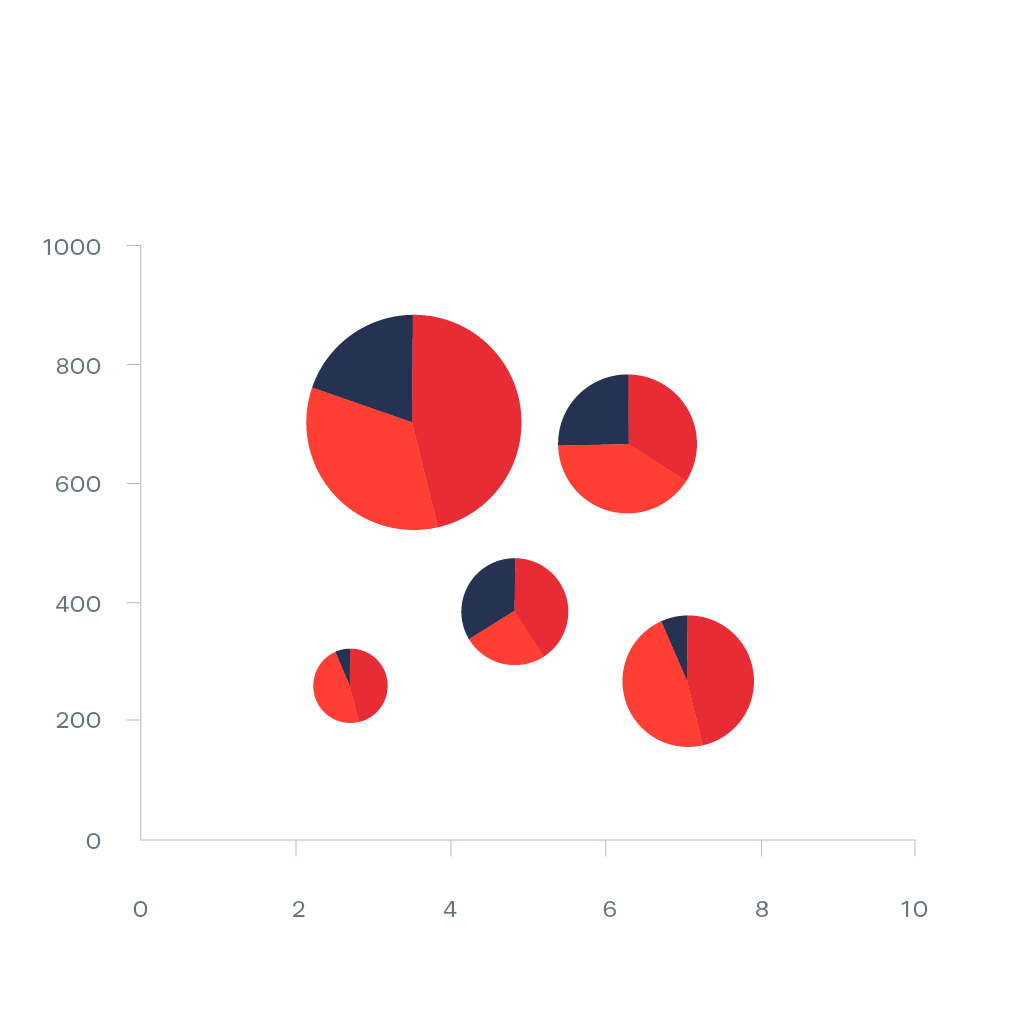
Bubble pie chart is a unique bubble chart that allows you to show/compare/relate performance across four paramenter sets instead of two. The third value determines the size of the bubble marker, the fourth by the % of pie while the other two are determined by the position on the axis.