Boxplot
Also called: Box Plot

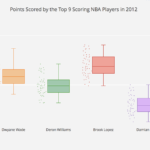
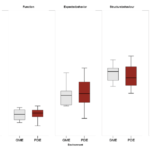
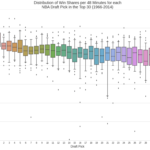
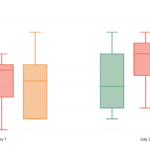
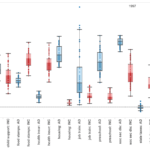
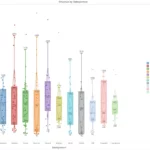
In descriptive statistics, a boxplot is a convenient way of graphically depicting groups of numerical data through their quartiles. A box plot displays median, higher/lower quartiles and maximum/minimum. Outliers may be plotted as individual points. The spacings between the different parts of the box indicate the degree of dispersion (spread) and skewness in the data, and show outliers. Box plots can be drawn either horizontally or vertically.
The violin plot is similar to boxplots, except that they also show the probability density of the data at different values.

