About Data Viz Project
What is this?
Data Viz Project is the world’s biggest library of data visualizations. With more than 160 (still counting) different types of data visualizations presented, each with definitions, taxonomies, and examples, it’s the most comprehensive collection, where you can find the right one and get inspired.
Data Viz Project is not limited to only data analysts, graphic designers, or heavy spreadsheet users; it’s also intended to serve as great value and inspiration for everyone with the need to visualize data and wanting to find new ways of doing so, whether they’re students, researchers, journalists, designers or another data cruncher.
The project is in progress and will continuously be improving and adding more data visualizations, more examples, and new ways of searching, among other things.
Who made it?
We are Ferdio – an infographic and data visualization agency from Copenhagen, Denmark.
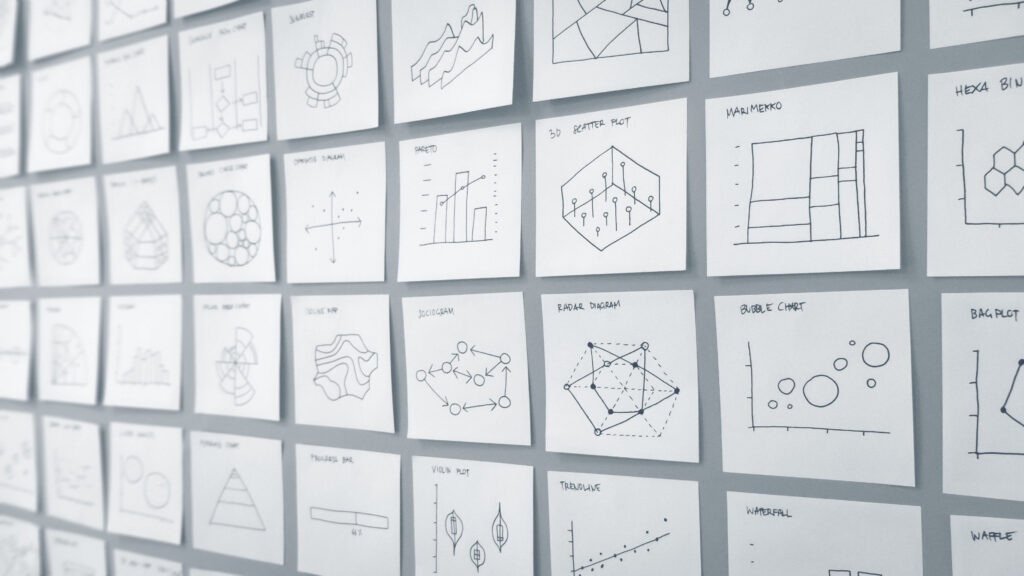
The project is as old as Ferdio. Without knowing it was an actual project, we simply started sketching post-it-sized prints of the most used data visualizations as an internal tool for our client projects. 10 became 50, then 100, and quickly our office wall was covered in paper dataviz. This is where we realized the potential, and 4 years and hundreds of hours later of research, design, development, QA, we were able to share the project as a website with the world.
Today, as an information design agency, we continue transforming data and information into captivating visuals. We add value to data and information by telling visual stories that inform and inspire.
Features
Search your way
The toolbar makes it easy to find relevant data visualization types. Maybe you know the name or the function, or you have no idea but only a specific set of data. Therefore, we established a data viz taxonomy and incorporated multiple search options to accommodate these different user scenarios.
Get inspired
Data Viz Project is a resource to get you inspired by the many ways to visualize data. A bar chart is not simply a bar chart. So for each data viz we’ve collected interesting and creative examples from actual projects, so you don’t have to do the work. We also offer a dedicated inspiration page that pick new examples every time across all the visualizations!
Other forms
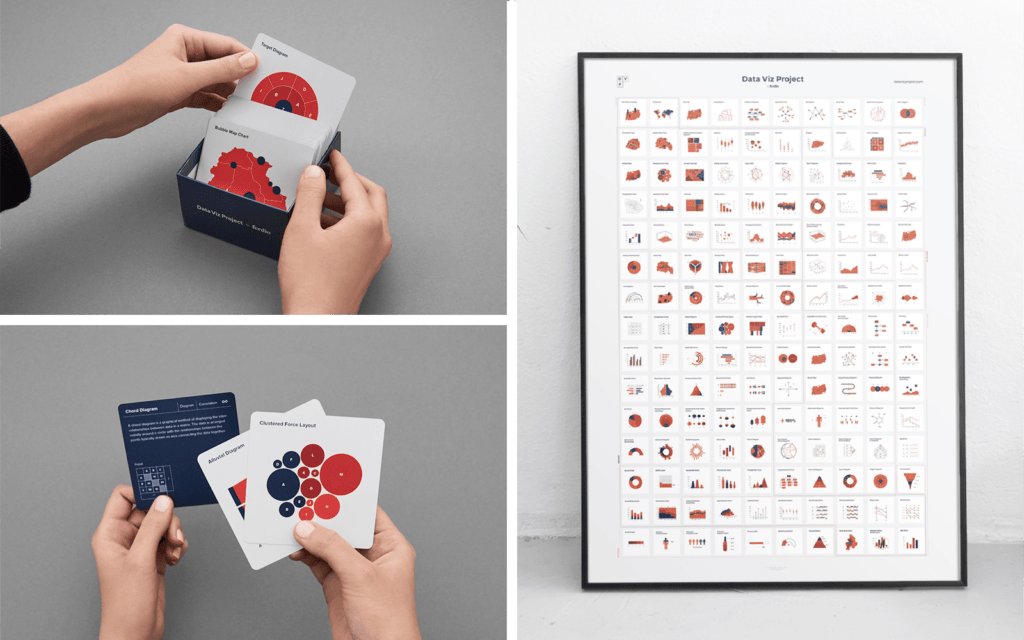
In general, we want Data Viz Project to help people make better decisions with data visualization. Currently, it’s a website, but it doesn’t mean it’s limited to this format. We’re constantly looking into how to adapt to other contexts. And due to the constant interest and feedback we’re receiving, new formats are in the making, including cards and posters among other things.
Acknowledgment
Two million web visitors, five awards, and massive media coverage. The interest and reactions have been overwhelming. Still are. But most importantly we appreciate all of the continuous messages in our inboxes and social media mentions of how people enjoy and make use of the project. Keep’em coming!
- Information Is Beautiful Awards 2017
- FastCompany’s Innovation by Design Awards 2018
- Creativity International Awards 2018
- Malofiej Awards 2018
- DataComms Awards 2023
One more dataviz project
In addition to the project, another data visualization project saw the light of day: 1 dataset, 100 visualizations. Here we wanted to put the Data Viz Project into practice and show the diversity and complexity of data viz, aiming to inspire and enlighten people to be conscious about the way they interpret their data. It demonstrates how even the simplest dataset can be turned into 100 proper data visualizations telling different stories, using very limited visual properties and assets.
![]()
Visit 1 dataset, 100 visualizations
Connect
You can follow Data Viz Project on Instagram and Facebook. You can also visit our feedback forum and let us know if you find any errors, bugs or you simply have suggestions for the website in general. We would love to hear what you think! As for work or partnership inquiries, please email us 🙂
Instagram
Facebook
Feedback forum
Email
Copyright
Data Viz Project is copyright Ferdio and available under a Creative Commons Attribution – Non Commercial – No Derivatives 4.0 International license.